Create a report manually when you need a one-off document or want to build the report layout directly in Word. Start with a Word document, insert an infrared image, and then add its related pictures, graphs, fields, and tables.
Use the Thermo Reports tab to insert and manage report elements. See Thermo Reports tab for a command reference.

Add an infrared image
Each report section that contains thermography data must have an infrared-image report element. This element establishes the source image for related graphs, fields, and tables in the section.
An empty infrared-image placeholder looks like this:
1.Place the cursor where you want to insert the infrared image.
2.Select Infrared Image on the Thermo Reports tab.
3.Double-click the new placeholder.
4.Open the required infrared image in IRT Cronista.
5.Make any required analysis changes.
6.Select Apply to Report on the Switch to Report toolbar.

The placeholder is filled with the rendered infrared image and its analysis overlays.
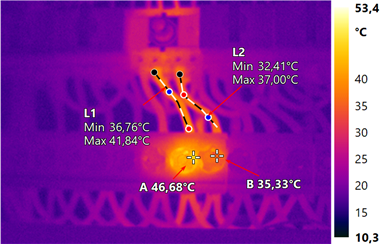
Edit the linked infrared image
Double-click a filled infrared image to edit it. The image normally opens in the in-place editor. If in-place editing is unavailable, it opens in the main IRT Cronista window.
In the in-place editor, change the Temperature Scale settings or measurement objects. Click outside the editor to save the changes to the source image and update the report. Press Esc to cancel the in-place changes. If the image opens in the main IRT Cronista window, select Apply to Report after editing.
To replace the source image or edit it in the main IRT Cronista window, use Browse for Images. See Editing generated reports.
Show or hide the temperature scale
1.Select the infrared image in Word.
2.Select Edit on the Thermo Reports tab.
3.Select or clear the Include temperature scale check box.
4.Select OK.
Note: The Word report contains a rendered picture and a link to the source infrared image. It does not contain the complete radiometric source data. Keep the source image available if the report may require further analysis. |
Add related pictures and graphs
Add related report elements after filling the infrared-image placeholder in the section.
·Visual Image: Inserts the visual image associated with the infrared image.
·Profile: Inserts a temperature profile for a line object.
·Histogram: Inserts a temperature-distribution histogram for an area object.
·All Pictures: Opens a dialog containing all supported picture and graph types, such as a trend.
Place the cursor at the required location, and then select the corresponding command in the Pictures and Graphs group.
The source infrared image must contain one line object for each profile and one area object for each histogram. The first profile uses line 1, the second profile uses line 2, and so on. Histograms use area objects in the same way.
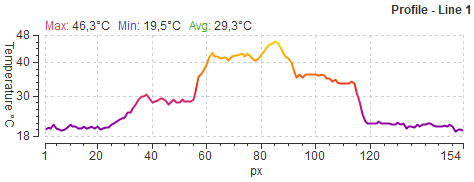
To change a profile or histogram, edit the corresponding line or area object on the source infrared image and update the report.
Add fields
A report field displays one item of image or analysis data, such as a file name, image date, spot temperature, or formula result. Insert the infrared image before adding fields to its section.
1.Place the cursor where you want to insert the field.
2.Select Field on the Thermo Reports tab.
3.Select the required data item in the Report Field dialog.
4.Select the visible measurement-object index when the field uses an indexed object.
5.Select the Source IR image when the section contains multiple infrared images.
6.Select OK.
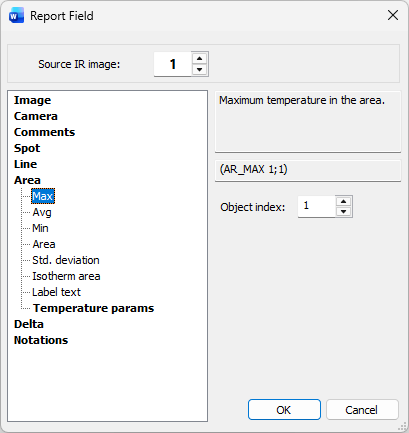
A populated report field displays its value as normal Word text, for example  . Apply Word text formatting as needed.
Change or delete a field
Double-click a report field to change its settings. You can also place the cursor in the field and select Edit on the Thermo Reports tab.
To remove a field, select it and then select Delete on the Thermo Reports tab.
Do not use Word's Edit Field command for fields created by the Thermo Reports add-in.
Add tables
A report table combines several fields. An analysis table creates the required rows for compatible indexed measurement objects and updates those rows when the source-image analysis changes.
1.Place the cursor where you want to insert the table.
2.Select Table > Image Info or Table > Analysis Info on the Thermo Reports tab.
3.Add the required rows in the Report Table Editor.
4.Arrange the selected rows with the arrow buttons.
5.Select the Source IR image when the section contains multiple infrared images.
6.Select OK.
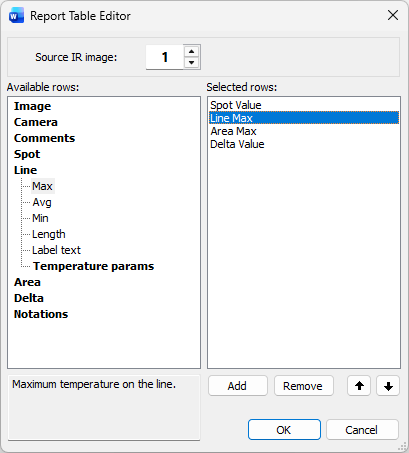
To insert image notations and optional comments, select Table > Notations. See Notations in reports.
Format, change, or delete a table
Use Word's table-formatting tools to format the inserted table. The add-in retains the formatting when it refreshes the table.
The following examples show the default table formatting and a table formatted in Word.
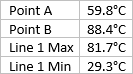
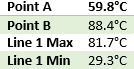
Double-click a report table to change its rows or source image. You can also place the cursor in the table and select Edit.
To remove a report table, place the cursor in it and select Delete.
Use multiple infrared images in one section
Each infrared-image report element in a section has a visible source-image number. Related pictures, graphs, fields, and tables use this number to identify their source.
When you insert a related picture or graph into a section that contains multiple infrared images, the Placeholder Settings dialog opens. Select the required number under Source IR image.
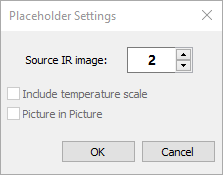
The field and table editors also provide the Source IR image setting. To relink an existing picture or graph, double-click it and select another source number.
Organize images in report sections
Sections divide a Word document into independently formatted parts and separate its infrared-image data. Image numbering restarts in each section, and report elements cannot link to an infrared image in another section.
For the simplest linking, place each infrared image and its related report elements in a separate section.
Add a section
Select New Section on the Thermo Reports tab to start a section on the next page. You can also insert a next-page or continuous section break with Word.
Duplicate a section
Duplicate a completed section when the next infrared image uses the same layout.
1.Click anywhere in the section that you want to copy.
2.Select Duplicate on the Thermo Reports tab.
The add-in inserts a copy immediately after the current section and clears its linked report data while retaining the layout.
By default, the duplicated section starts on a new page. To allow multiple sections on one page, select Settings and then select Several sections per page.
Add a summary table
Availability: Not included in the Standard edition
A summary table collects selected fields from the populated report sections. Each row normally represents one section.
Add at least one populated infrared-image section before creating the table.
1.Place the cursor where you want to insert the summary table.
2.Select Summary Table on the Thermo Reports tab.
3.Add the required columns in the Summary Table Editor.
4.Arrange the selected columns with the arrow buttons.
5.Configure the settings for each selected column.
6.Select OK.
7.Format the table with Word's table-formatting tools.
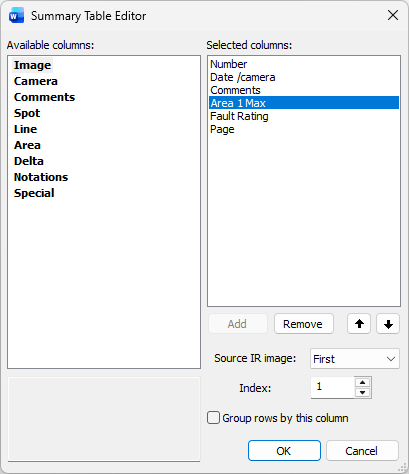
The Special category contains two columns:
·Number: Displays the image number in the report, which corresponds to the summary-table row number.
·Page: Displays the page containing the corresponding infrared image.
Use Index to select a specific indexed measurement object. For a section containing multiple infrared images, use Source IR image to select the First or Last image; intermediate images are not available for summary-table columns.
Select Group rows by this column to combine report rows that have the same value in that column. When more than one column is grouped, all grouped values must match.
Double-click an available column to add it or a selected column to remove it.
Summary tables do not refresh automatically after report data changes. Select the table, and then select Summary Table > Update.
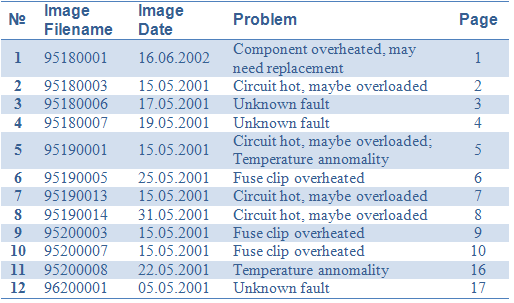
The following image shows a formatted summary table.
Save the finished report with Word.