Availability: Professional and Ultimate editions
Use trends to compare temperatures across a sequence of infrared images. A trend plots corresponding image or measurement-object values from the current folder. If the focused image belongs to an image stack, the trend uses the images in that stack instead.
A trend requires at least two infrared images and can include up to 50 images.
How objects are matched
IRT Cronista matches measurement objects by object type and index. Spot indices are A, B, C, and so on. Line and area indices are 1, 2, 3, and so on. Default object names include these indices, so corresponding objects normally have the same name in different images.
If you customize object names, the program still matches the objects by type and index. You can use an analysis template to add the same set of measurement objects to multiple images.
Display the trend
1.Select View > Windows > Graphs if the graphs area is hidden.
2.Select the Trend tab.
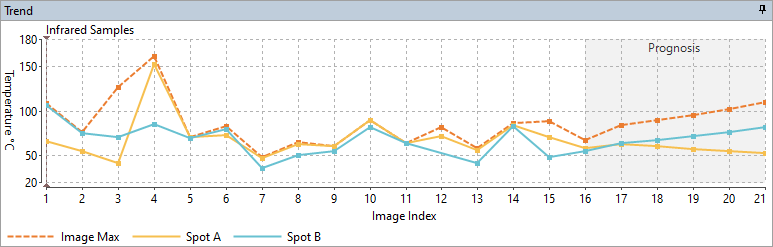
The vertical axis shows temperature. The horizontal axis follows the current image order. If acquisition times increase throughout that order, the axis shows Time; otherwise, it shows Image Index. To display the images chronologically, sort them by ascending date and time. See Sorting files and folders.
A vertical cursor identifies the focused image. Drag the cursor to another image position to focus the corresponding image. Point to a graph to view its temperature and, on a time axis, its date or time.
Choose values to graph
The trend can display the following values:
§Image Max: The maximum temperature in each infrared image.
§Spots: The temperature measured by each corresponding spot.
§Lines and areas: The maximum temperature measured by each corresponding object.
§Temperature deltas: The value calculated by each corresponding temperature-delta object.
To choose the values:
1.Right-click the Trend graph.
2.Select Trend Objects ....
3.Select the check box for each value to display.
4.Click OK.
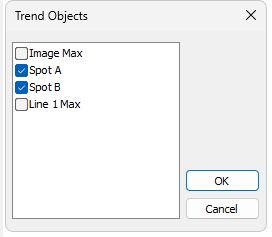
The Trend Objects dialog lists Image Max and measurement objects from the focused image. An image that does not contain a corresponding selected object does not contribute a data point for that graph.
Note: In automatic mode, IRT Cronista graphs up to six object identities found in both of the first two images. If they have no corresponding measurement objects, it graphs Image Max. Clear every check box in Trend Objects to return to automatic selection. |
To copy the graph to the Clipboard, right-click the Trend graph and select Copy.
Show a prognosis
The prognosis extends each trend with estimated future values calculated from a quadratic approximation of the available data. Use it as an indication of direction, not as a validated forecast.
Right-click the Trend graph and select Prognosis to show or hide the extrapolated section.