Use area measurement objects to analyze temperatures within a region of an infrared image. An area can display its minimum, maximum, and average temperatures and produce a histogram of the temperature distribution.
Choose the area type from the area-tool submenu:
§Rectangle: Draws a rectangular area.
§Ellipse: Draws an elliptical or circular area.
§Polygon: Draws an area with three or more sides.
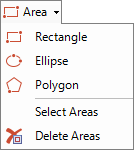
Draw a rectangle or ellipse
1.Open the area-tool submenu on the analysis toolbar. 2.Select Rectangle or Ellipse. 3.Drag diagonally across the region to measure in the focused image. |
Draw a polygon
1.Open the area-tool submenu on the analysis toolbar. 2.Select Polygon. 3.Click the first vertex in the focused image. 4.Click each additional vertex in sequence. 5.Right-click to finish the polygon. |
View histograms
When you create an area, IRT Cronista displays its histogram in the Graphs area. The horizontal axis shows temperature. The vertical axis shows the percentage of pixels in each temperature interval.
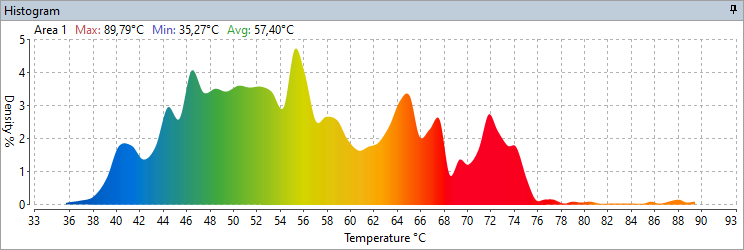
If the Graphs area is hidden, select View > Windows > Graphs.
If the focused image contains multiple areas, the graph displays all their histograms in different colors. The active area's histogram appears in red, and the displayed Min, Max, and Avg values apply to that area.
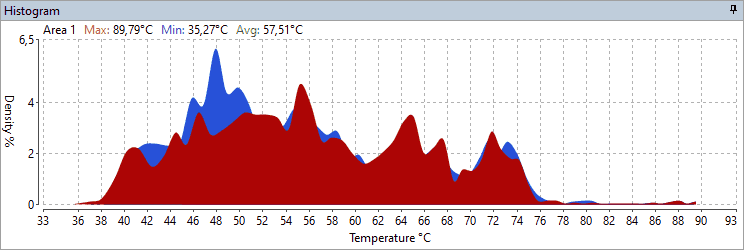
Right-click the graph to copy it or change settings for the active area.
Note: The Graphs area can display several histograms together. In a report, each histogram placeholder displays the histogram for one area object. |
Select or delete all areas
Open the area-tool submenu and select Select Areas to select all area objects in the focused image. Select Delete Areas to remove them.
For more information about selecting, reshaping, and editing measurement objects, see Selection tool.